Wireless Stats & Reports
Wireless Stats

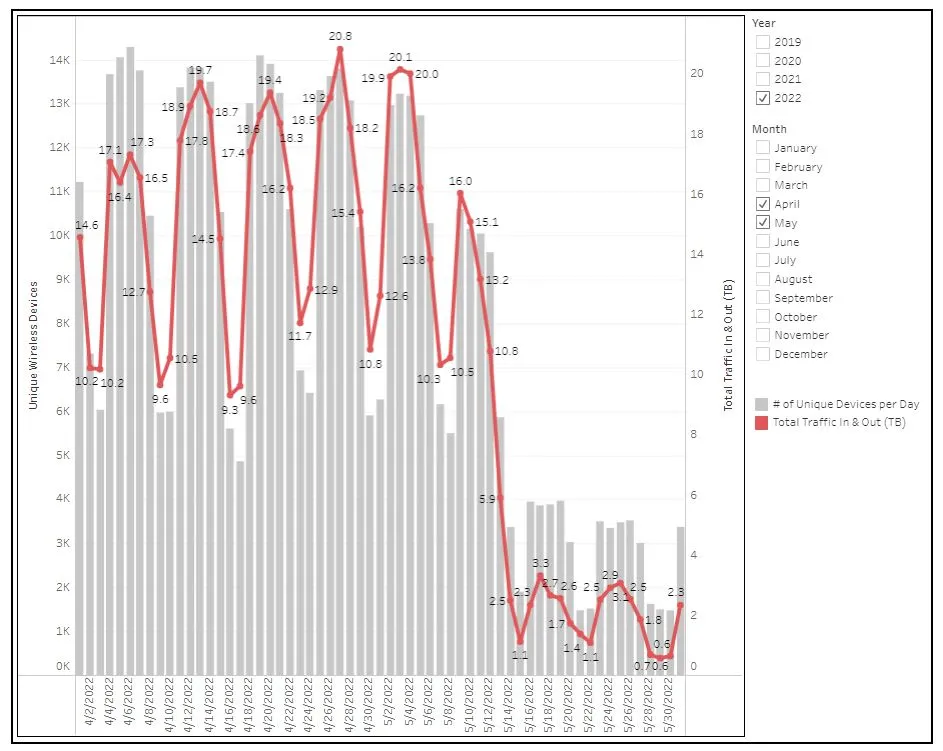
The Stats section contains various embedded Tableau graphs, charts, and other visualizations of different wireless stats. They are dynamically updated, and most have filters you can use to adjust and set the date range of data you wish to see.
Wireless Reports

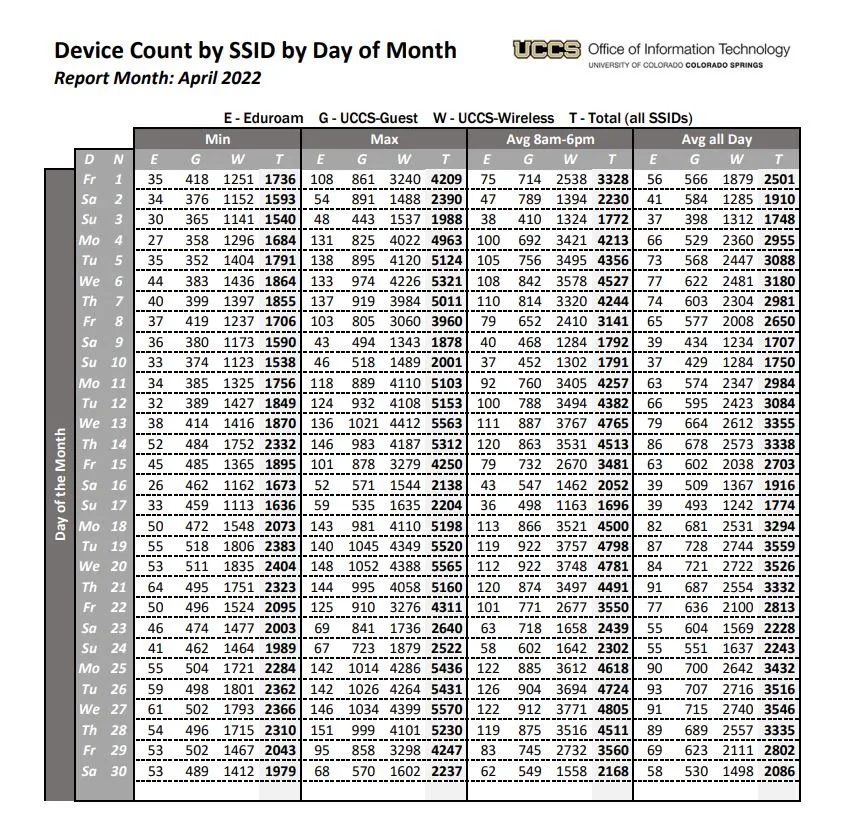
The Reports section contains various wireless reports in PDF format. Many reports are generated monthly, and some break down the data by week. Some reports may also contain embedded graphs and visualizations in addition to the table data.